
![[Writing Task 1 - Mix] The line graph and the table show a monthly-average temperature and precipitation of a particular area in the world.](https://www.hrsviet.com/uploads/0000/1/2026/01/20/rainfall-banner.jpg)
| Band 6.0-6.5 | Band 7.0 |
|
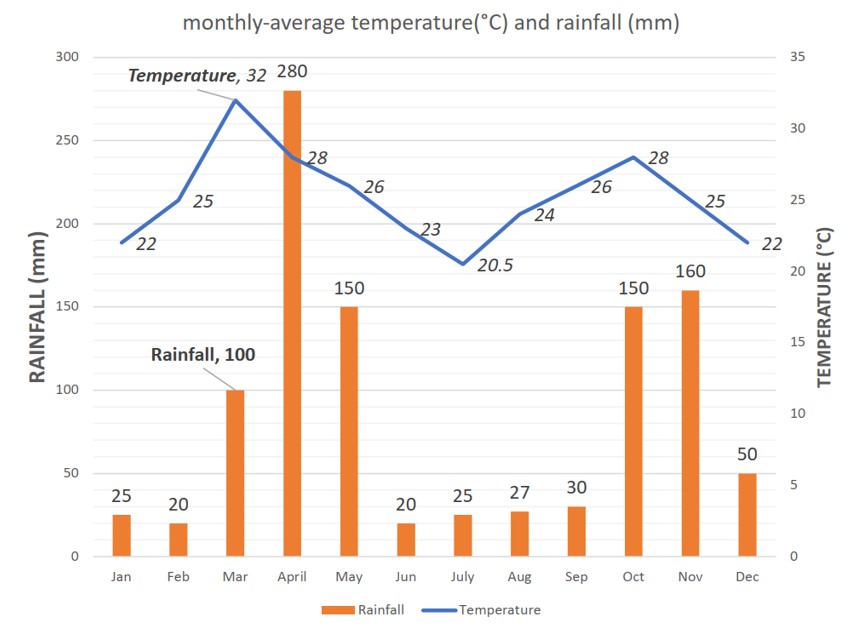
The precipitation increases steadily from around 25 mm in the first 2 months to about 100 mm in March, after which it begins to soar until April when it peaks at 280 mm. The precipitation tends to decrease in later months with a dramatic drop to as low as 20-30 mm from Jun to Sep. However, in the next 2 months, the graph shows an opposite trend with an increase to around 150-160 mm, followed by a decrease to 50 mm in Dec which is just one third as high as it is in Nov. Compared to the monthly precipitation, temperature witnesses a more modest fluctuation. From January to March, there is a gradual climb of temperature from 22 °C to just above 30 °C which is its maximum figure. The temperature starts to decline after March with a relatively gradual decline to the lowest point of 20.5°C in July. The tendency is more obvious between Aug and December when it backs to the figure in January. All in all, in January and December, both precipitation and temperature are low, and from June to September, the numbers are the lowest.
|
Overall, precipitation shows significant seasonal variation, peaking sharply in spring and reaching its lowest levels in mid-year, whereas temperature changes are comparatively moderate throughout the year. Precipitation rises steadily from approximately 25 millimetres in January and February to around 100 millimetres in March, before increasing dramatically to a peak of about 280 millimetres in April. After this point, rainfall declines substantially, falling to its lowest range of roughly 20 to 30 millimetres between June and September. In the following two months, precipitation rebounds to around 150–160 millimetres, before dropping again to approximately 50 millimetres in December, which is roughly one third of the figure recorded in November. In contrast, temperature experiences a much smaller fluctuation over the year. From January to March, it rises gradually from 22°C to just over 30°C, the highest level observed. Thereafter, temperatures decrease steadily, reaching a low of approximately 20.5°C in July. From August onwards, the temperature recovers gradually and returns to a level similar to that seen at the beginning of the year by December. |
|
⚠️ Hạn chế: Overview chưa thật sự rõ ràng (nên tóm tắt xu hướng chính ngay đầu hoặc cuối đoạn) Lỗi ngữ pháp nhẹ nhưng lặp lại: Một số liên kết còn hơi “nói”:
Lỗi / chưa học thuật: |
✅
|